Figure 1.

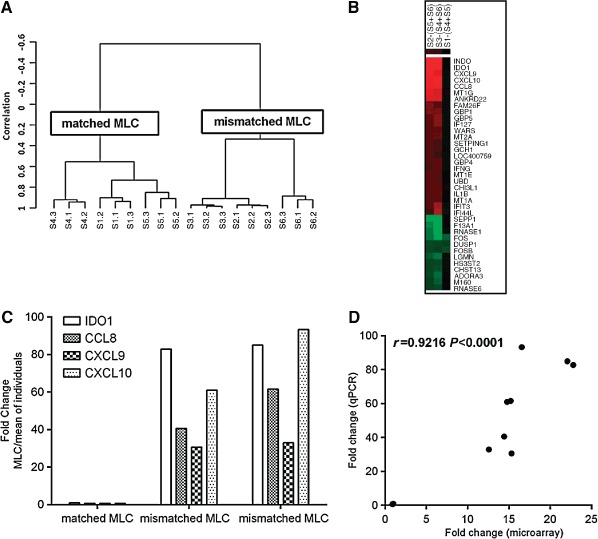
(A) Hierarchical clustering using the set of genes with the most variable mRNA expression (SD > 0.75) defining two major clusters. Clustering was performed using centered correlation and average linkage in BRB‐Array Tools. S1 = S4 + S5 matched mixed lymphocyte culture (MLC), S2 = S5 + S6 and S3 = S4 + S6 mismatched MLC, S4 and S5 matched siblings, S6 mismatched individual. (B). Heatmap of fold‐changes of regulated genes in the mismatched MLC [S2 − (S5 + S6) and S3 − (S4 + S6)] and the matched MLC [S1 − (S4 + S5)]. cluster 3.0 and tree view software were used. Genes with a fold change of ±5 are presented. Red colour indicates upregulated genes, green colour downregulated genes and black colour indicates no change. (C) Upregulation of IDO1, CCL8, CXCL9 and CXCL10 was verified using qPCR shown as fold change in the MLC vs the mean expression of the individuals (MLCs were at a 1:1 ratio). (D) Correlation between fold changes for IDO1, CXCL9, CXCL10 and CCL8 calculated by microarrays and qPCR; Pearson's correlation is shown.
