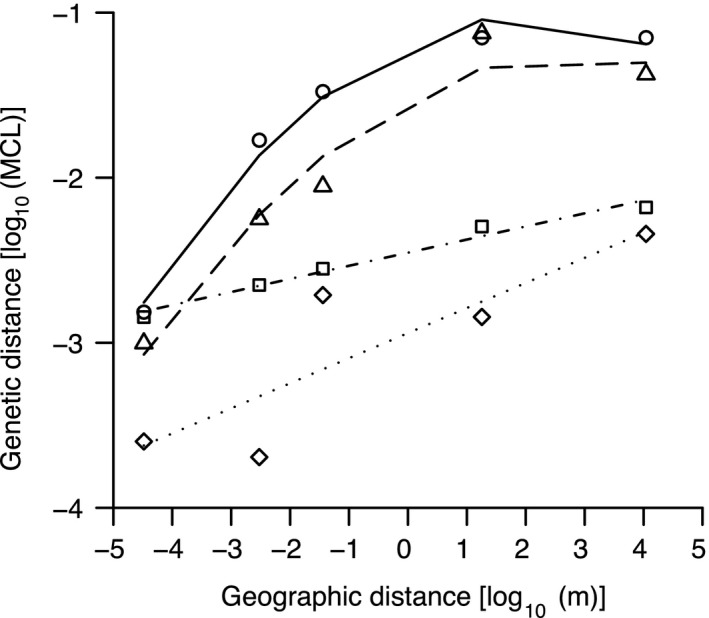
Figure 3.

Geographic‐ vs. genetic‐distance relationships can be clade specific. Symbols represent mean pairwise genetic distance at each scale for the entire data set combined (circles) and for each of the three major phylogenetic clades. Best‐fit lines reflect second‐order polynomials for the total set and Clade 3 (triangles) and linear regression for Clades 1 and 2 (squares and diamonds, respectively). MCL = maximum composite likelihood of base substitution in mega version 5.1 (Tamura et al. 2007).
