Figure 3.

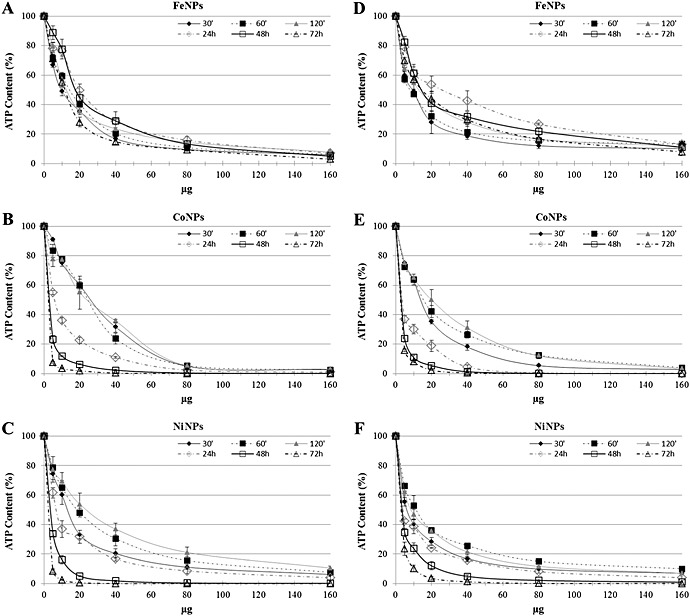
Percentage of ATP content, normalized to control, in SKOV‐3 and in U87 exposed to FeNPs (A,D), CoNPs (B,E) and NiNPs (C,F) for different times. Bars represent standard errors. ATP, adenosine triphosphate; NPs, nanoparticles.

Percentage of ATP content, normalized to control, in SKOV‐3 and in U87 exposed to FeNPs (A,D), CoNPs (B,E) and NiNPs (C,F) for different times. Bars represent standard errors. ATP, adenosine triphosphate; NPs, nanoparticles.