
Figure 5.
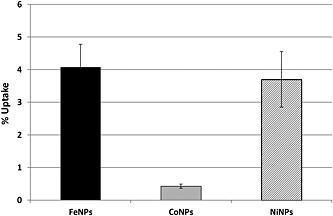
Quantitative evaluation of the cellular uptake of Fe, Co and Co‐NiNPs expressed as percentage of the initial mass of NPs. Bars represent standard errors. NPs, nanoparticles.
Official websites use .gov
A
.gov website belongs to an official
government organization in the United States.
Secure .gov websites use HTTPS
A lock (
) or https:// means you've safely
connected to the .gov website. Share sensitive
information only on official, secure websites.
Quantitative evaluation of the cellular uptake of Fe, Co and Co‐NiNPs expressed as percentage of the initial mass of NPs. Bars represent standard errors. NPs, nanoparticles.