Figure 6.

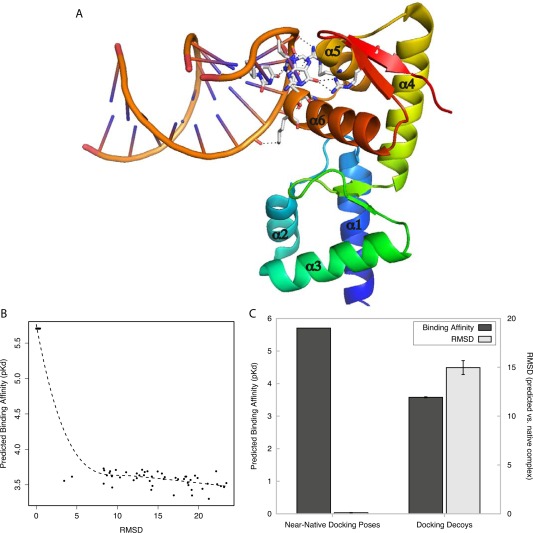
Protein‐DNA/RNA affinity prediction differentiates near‐native complexes from docking decoys. Using molecular docking simulations, near‐native poses and docking decoys were generated for a case study of a protein‐DNA/RNA complex (SelB‐mRNA complex, PDB ID: 1WSU). A: Crystal Structure of SelB‐mRNA complex. Hydrogen bonds between SelB and its mRNA ligand are indicated by dashed lines, and alpha helices are numbered. B: Predicted binding affinity (y axis) is plotted against the root mean square deviation (RMSD, in angstroms, x axis) between each generated complex and the SelB‐mRNA crystal structure. Dotted line indicates the best‐fit polynomial regression. C: We separated generated SelB‐mRNA docking complexes into near‐native poses (RMSD ≤ 3.4 Å) and docking decoys (RMSD ≥ 3.4 Å). The plot shows the mean predicted binding affinity of complexes in each group (dark gray, left y axis) and mean RMSD between generated complexes and the experimentally determined SelB‐mRNA structure (light gray, right y axis). Bars indicate standard error.
