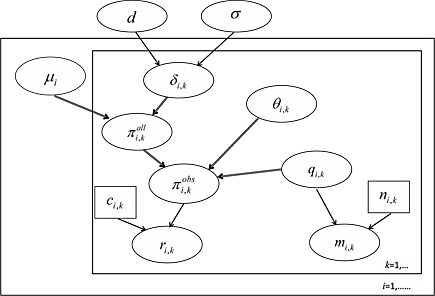
Figure 1.

Directed acyclic graph (DAG) of our missing data framework: μ i,kis the study‐specific log‐odds of the outcome in treatment 1 (the control), δ i,kis the log‐odds ratio, , , r i,kis the number of observed events, c i,kis the number of observed outcomes, θ i,kis the missing data parameter, q i,k=p(missing), m i,kis the number of missing outcomes and n i,kis total number randomised. Ellipses denote stochastic parameters or observed data. Small boxes denote constants. The two large boxed (‘plates’) represent indexing of studies iand treatments k. Single line arrows denote stochastic relationships, and double‐line arrows denote logical relationships. Note that c i,k=n i,k−m i,k; however, we omit the logical relationship between these parameters in the DAG, as c i,kis constant conditional on the observed number of missing outcomes.
