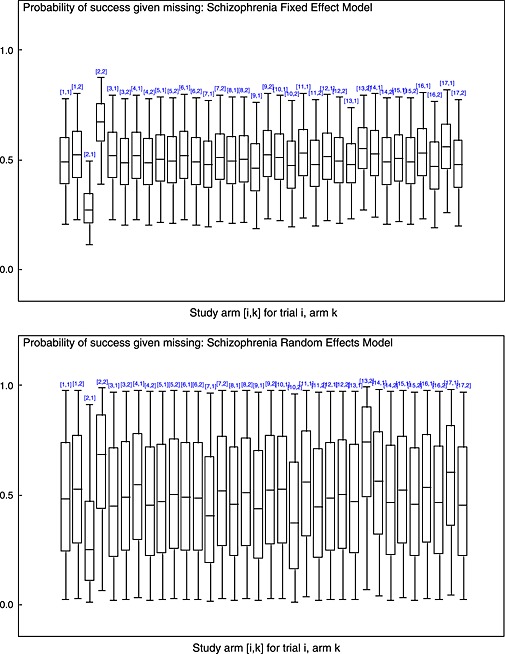
Figure 3.

Box‐plots of posterior distribution for for each study arm [i,k] for trial i, arm kin the schizophrenia meta‐analysis 19. Plotted for fixed and random effect models where a missing data model is used with Beta(1,1) priors for . Boxes represent inter‐quartile range, the whiskers represent the 95% CI and line within the box represents the median.
