
Figure 3.
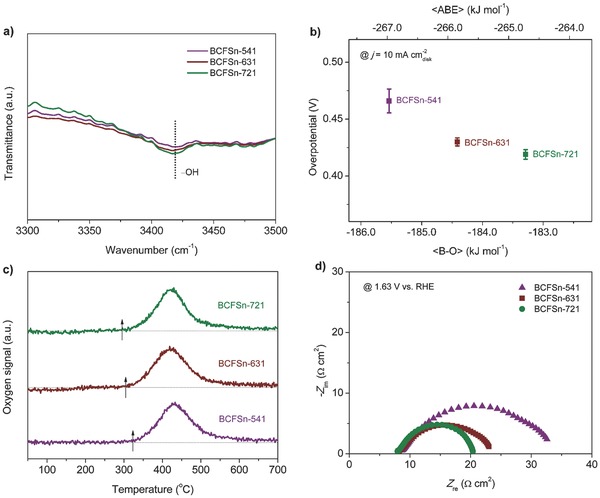
a) FT‐IR spectra of BCFSn perovskites after exposure to 0.1 m KOH. b) Correlation between the OER activity of BCFSn catalysts and the average B–O bond energy (〈B–O〉) or the average metal (A, B)–O bond energy (〈ABE〉) within each perovskite lattice. c) O2‐TPD profiles of BCFSn perovskites; arrows indicate the temperatures at which O2 desorption occurs. d) Electrochemical impedance spectra of BCFSn catalysts recorded at 1.63 V vs RHE under the influence of an AC voltage of 5 mV.