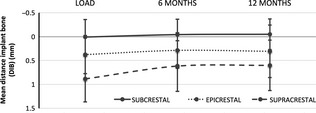
Figure 5.

Mean bone level changes from loading (baseline) to 12‐month follow‐up according to the implant insertion level classification. Vertical axis represents the mean DIB measured at each period, and the slope of the curve reflects the bone level changes variation between two consecutive periods. Values in mm.
