
Figure 3.
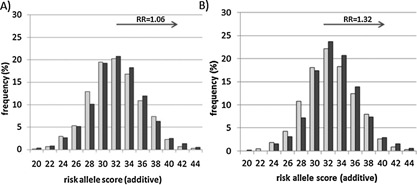
Analysis polygenic score by diagnosis in NIMH families comparing cases to all other relatives. The distribution of risk scores in patients affected with BPI or SAB (dark grey bars) were compared to all other relatives (light grey bars). For the purposes of graphical representation, the frequency of risk scores are represented in even integers, and represent bins which include both odd and even scores (i.e., bin 22 is the sum of the frequency of 22 and 23 risk alleles). Relative risk (RR) estimates were calculated with respect to an additive risk score of ≥32. A) All NIMH families (n = 249) included 600 cases and 715 other relatives. No significant differences were observed between mean risk scores in case versus all other relative groups (mean = 32.69 ± 3.94 vs. 32.45 ± 3.85; GEE‐Wald χ2 = 1.19, df = 1, P = 0.13). Relative risk was not significant (RR = 1.06 (95%CI = 0.96–1.17), P = 0.14). B) Selected NIMH families with a high polygenic load (n = 202), where two or more individuals from each family had a risk score of ≥32. The mean risk score was significantly higher in cases (n = 518) compared to all other relatives (n = 613)(mean = 33.40 ± 3.62 vs. 32.95 ± 3.70; GEE‐Wald χ2 = 4.78, P = 0.014). The distribution of risk scores in patients affected with BPI or SAB were shifted significantly towards the right compared to their other relatives, with a significant increase in relative risk in cases (RR = 1.32 (95%CI = 1.03–1.70), P = 0.018).