
Figure 4.
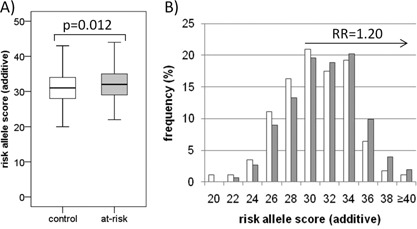
Polygenic risk score analysis in young European at‐risk individuals compared to controls. The total numbers of risk alleles per individual were scored using an additive model, using only subjects of European descent. At‐risk (n = 334) and control (n = 142) groups are represented by the grey and white bars, respectively. A) The mean risk score was significantly higher in at‐risk subjects (31.99 ± 0.27) than controls (31.07 ± 0.31) (GEE‐Wald χ2 = 5.15, 0.012). B) The distribution of risk scores in at‐risk subjects was shifted toward the right relative to control subjects. For the purposes of graphical representation, the frequency of risk scores are represented in even integers, and represent bins which include both odd and even scores (i.e., bin 22 is the sum of the frequency of 22 and 23 risk alleles). The relative risk (RR) estimate of 1.20 (95%CI = 0.99–1.45) was calculated with respect to a risk score of ≥32, with an overall odds ratio of 1.44 (95%CI = 0.99–2.09).