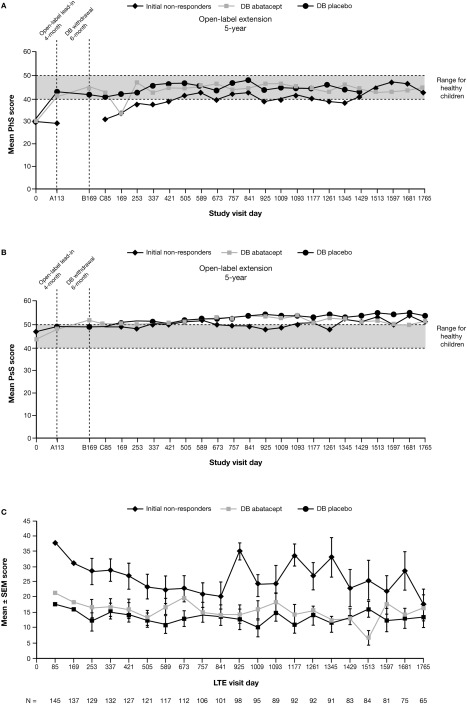
Figure 3.

As‐observed and patient‐ and parent‐reported outcomes over time. A and B, Mean Child Health Questionnaire (CHQ) physical summary (PhS) scores (A) and mean CHQ psychosocial summary (PsS) scores (B). On the x‐axis, A, B, and C indicate the 3 study periods. The broken horizontal lines represent a standardized mean score of 50 (and 1 SD below [score of 40]) for the normative population (see ref. 22). C, Parent's global assessment of pain over time. n = the number of patients with available data at each visit day. DB = double‐blind outcomes during the open‐label long‐term extension (LTE) phase. Data were derived from an as‐observed analysis based on all patients who entered the LTE phase.
