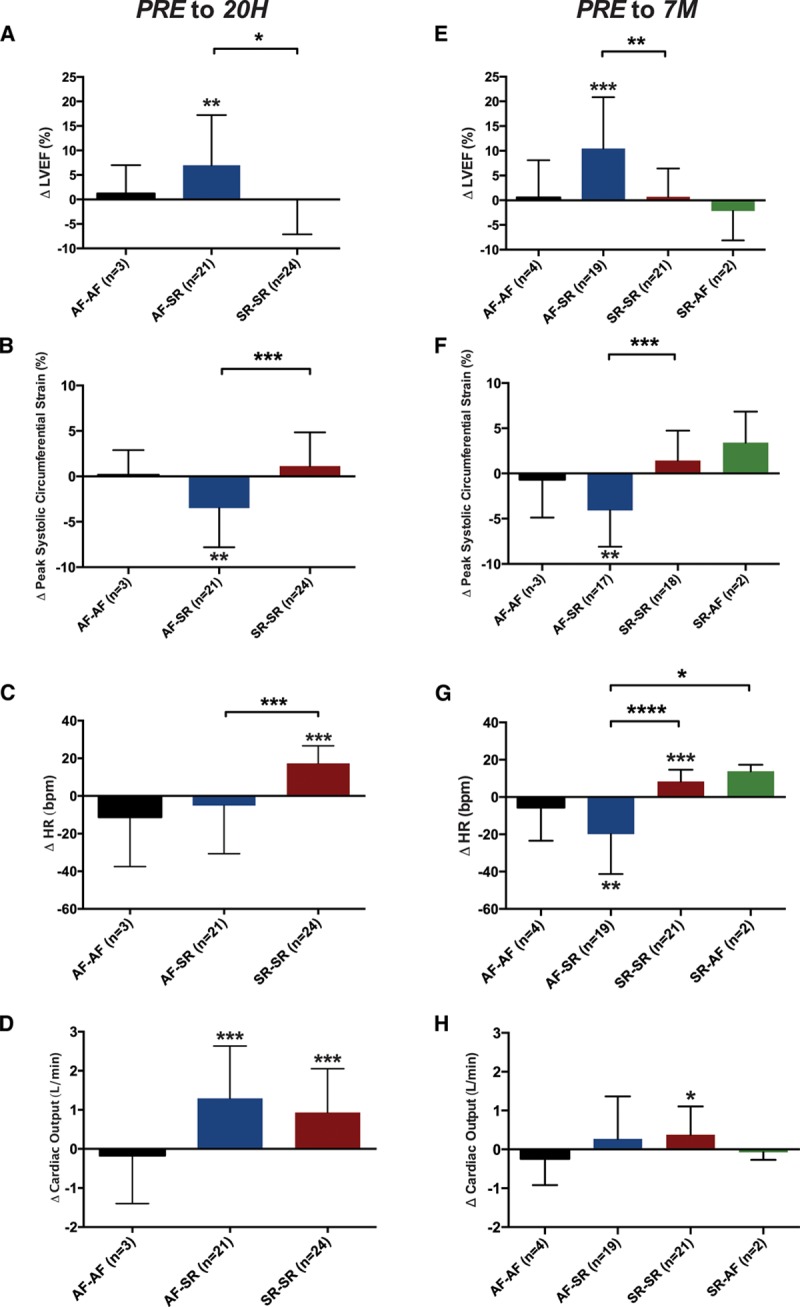
Figure 4.

Change in left ventricular (LV) ejection fraction(EF), peak systolic circumferential strain (PSCS), heart rate (HR), and cardiac output early and late after ablation, categorized by the intrascan rhythm at each time point. One-sample t tests assessed whether changes within each subgroup are significantly different from zero. Changes between subgroups were compared by use of 1-way ANOVA; P values for subgroup comparisons are Bonferroni corrected for multiple comparisons. A, At 20 hours (20H), LVEF improves only in the atrial fibrillation (AF)–sinus rhythm (SR) subgroup (P=0.005). B, Similarly, PSCS also improves only in the AF-SR subgroup (denoted by a more negative change; P=0.001). C, Only the SR-SR subgroup shows a significant increase in HR early after ablation (P<0.001), and both the AF-SR and SR-SR subgroups show a significant increase in cardiac output, without differences between subgroups (D). At 7 months (7M), the pattern of change in LV function from ≤4 weeks before ablation (PRE) in subgroups is similar to that at 20 hours, with the AF-SR subgroup alone showing significant improvement in LVEF (E; P<0.001) and PSCS (denoted by a more negative change; F; P=0.001). G, The changes in HR from ≤4 weeks before ablationin the AF-SR and SR-SR groups are significantly different (P<0.0001), and there is a significant difference between the AF-SR and SR-AF groups (P=0.03). H, Similar to 20 hours, there are no significant differences between subgroups in the change in cardiac output, with only the SR-SR subgroup demonstrating a small increase (P=0.03). Smaller P values stratified by size (**P<0.01, ***P<0.001, ****P<0.0001).
