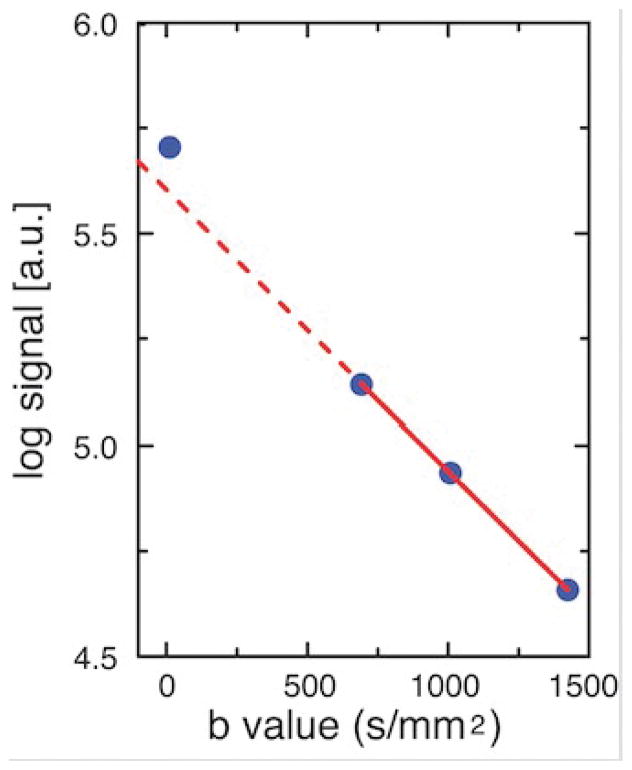
Figure 1.
Diffusion-weighted signal decay curve for right superior temporal gray matter (GM) in one subject from the study by Salminen et al. (25). The isotropic DWI (DWIiso) image was computed from the geometric mean of the DWIs at each of the four b values (b~0 and b= 680, 996, and 1412 s/mm2). The DWIiso signal intensity was measured from the geometric mean images using a ROI in superior temporal GM. The log of the DWIiso is graphed versus b value so that the monoexponentiality of signal decay can be assessed by the fit of the data to a straight line. The solid red line is fit to the three b ≥ 680 s/mm2 data points. The graph shows that the b~0 data point is artifactually above the dashed red line that is extrapolated from the fit to the other three data points. The DWIiso images at b~0 showed bright CSF signal, while the three DWIiso images with b ≥ 680 had absent CSF signal (not shown). Thus, the deviation in the b~0 data point indicates partial volume averaging with CSF in the adjacent sulci and Sylvian fissure. The observation that the three data points with b ≥ 680 fall on a straight line indicates monoexponential decay of gray matter after removing CSF effects. The artifactual deviation in the b~0 data due to CSF effects is somewhat muted by the large ROI, which contains some voxels that are not adjacent to CSF (for voxels adjacent to CSF spaces, the effect is stronger). The log of the ventricular CSF signal deviated from linearity at all data points (not shown), indicating a more complex signal behavior in CSF. The signal intensity and its log are in arbitraty units [a.u.].

