
Figure 4. HA labeling of ABCs and ASCs in blood after influenza vaccination and infection.
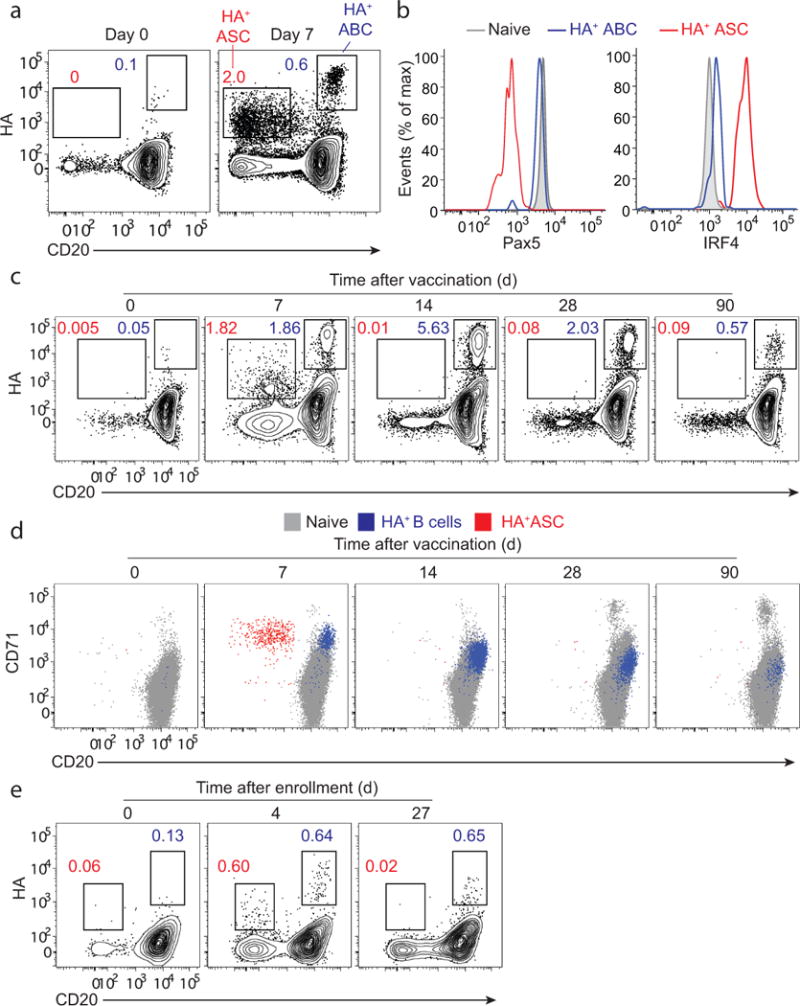
PBMCs isolated from healthy adult volunteers prior to, and 7, 14, 30 and 90 days after immunization with the 2013/14 TIV. (a) A FACS plot gated on isotype-switched B cells showing HA-positive ASCs (CD20lo) and HA-positive ABCs (CD20hi). (b) Histogram plots showing expression of Pax5 and IRF4 in HA-positive ABCs, HA-positive ASCs, and naïve B cells. (c) A FACS plot (gated on isotype-switched B cells) showing the kinetics of HA-positive B cells after TIV immunization. (d) A FACS plot showing CD71 expression on HA-positive ASCs (red dots) and HA-positive ABCs/MBCs (blue dots) overlaid over naïve B cells (grey dots) (e) PBMCs isolated from an influenza-infected patient. FACS plots gated on isotype-switched B cells showing HA-positive ASCs (CD20lo) and HA-positive ABCs (CD20hi) at days 0, 4 and 27 after enrollment.