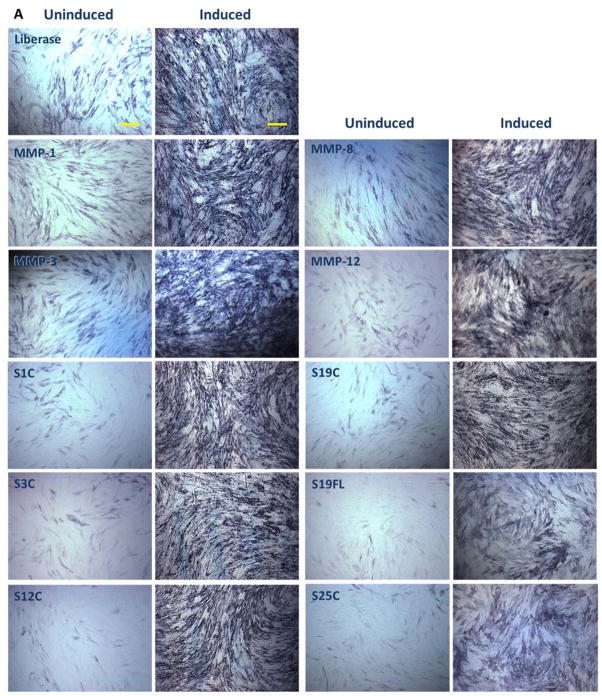
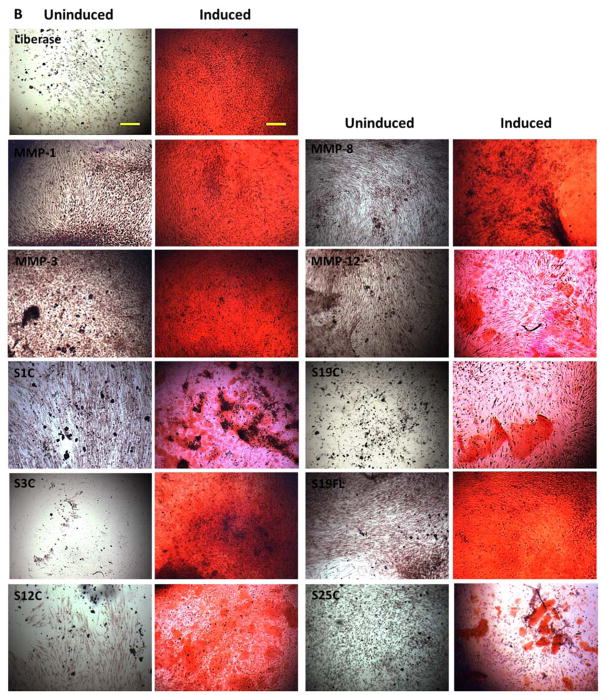
Figure 10.
Osteogenic differentiation of ADSCs. Cells were cultured in osteogenic induction medium (right panels) or in uninducing MesenPro medium (left panels) for 21 d. Images were captured at 10× magnification. Bars indicate 100 μm. Panel A: Alkaline phosphatase activity, which is indicative of osteoblastic differentiation, is shown as dark blue stain. Panel B: Mineralization of samples was detected by alizarin red S stain. Alizarin Red staining was used to detect precipitated calcium salt, which is a marker of differentiation. S1C = MMP-1 CAT domain, S3C = MMP-3 CAT domain, S12C = MMP-12 CAT domain, S19C = MMP-19 CAT domain, S19FL = full-length MMP-19, and S25C = MMP-25 CAT domain. MMP-1, MMP-8, MMP-3, and MMP-12 refer to the full-length enzymes.


