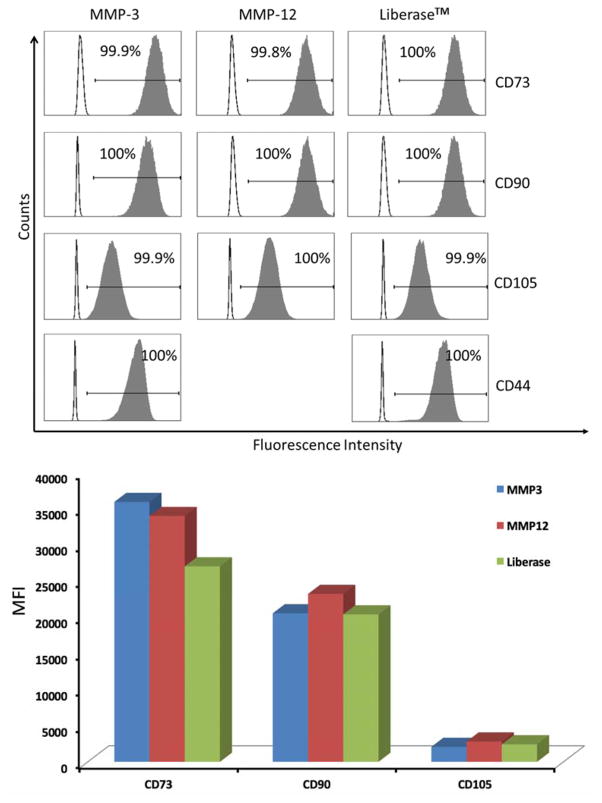
Figure 2.
(Top) Analysis of ADSCs for cell surface CD73, CD90, CD105, and CD44. Clear histograms represent cells stained with isotype control antibodies, and filled histograms represent the staining with a specific marker. The percentage of positive cells is indicated in each panel. Analysis of CD44 on cells isolated following MMP-12 treatment could not be performed due to insufficient cell numbers for the positive control. (Bottom) Comparison of Median Fluorescenece Intensities (MFI) of CD73, CD90, and CD105 on isolated ADSCs.

