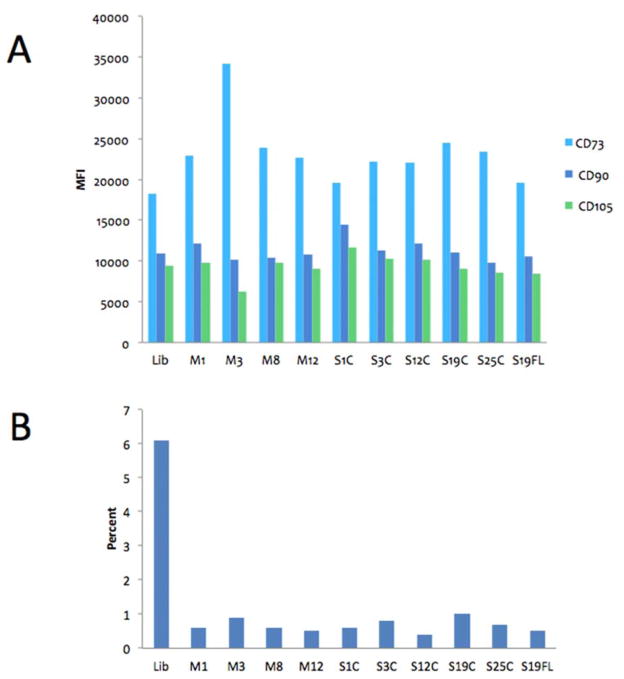
Figure 8.
Flow cytometry MSC-specific marker analysis of ADSCs isolated by Liberase™ and MMP treatments. Panel A: Median Fluorescence Intensity (MFI) of MSC-specific markers CD73 (light blue), CD90 (dark blue), and CD105 (green) of all cells subjected to flow cytometry. Panel B: Percentage of non-MSC marker staining (negative mix) in the same population as shown in panel A. Lib = Liberase™, M1 = MMP-1, M3 = MMP-3, M8 = MMP-8, M12 = MMP-12, S1C = MMP-1 CAT domain, S3C = MMP-3 CAT domain, S12C = MMP-12 CAT domain, S19C = MMP-19 CAT domain, S25C = MMP-25 CAT domain, and S25C = full-length MMP-25.

