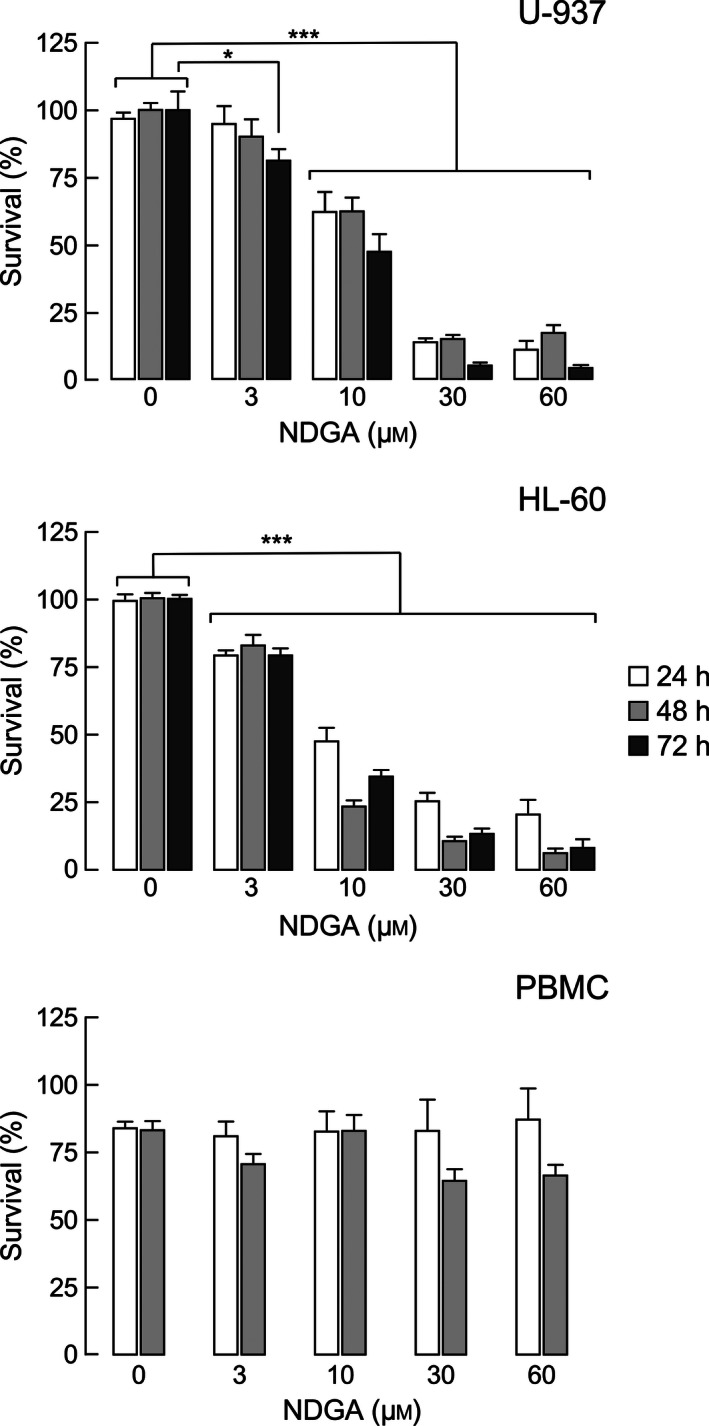
Figure 1.

Survival of leukemic cell lines treated with various concentrations of NDGA. Bar graphs represent survival of HL‐60, U‐937, and PBMC cells treated with the indicated NDGA concentrations during 24, 48 or 72 h, respectively. Cell viability was assessed by neutral red assay. The values are expressed as the mean of surviving cells (% of control) ± SEM of four independent experiments performed in triplicate. Significance was determined by a two‐way ANOVA and Bonferroni post‐test. ***P‐value < 0.001; *P‐value > 0.05. For PBMC cells, the statistical analysis was not significant, P‐value > 0.05.
