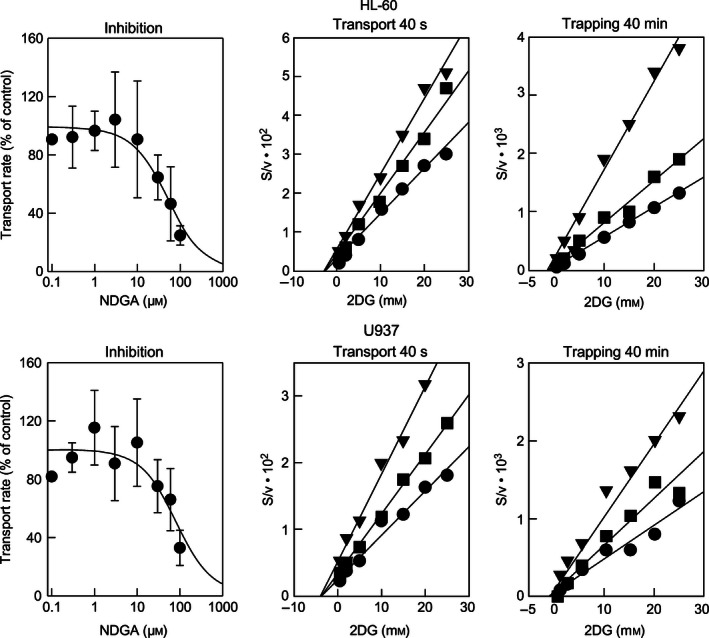
Figure 2.

Effect of NDGA on 2DG transport and trapping in HL‐60 cells (upper panels) and U937 cells (lower panels). Inhibition panels correspond to experiments in which transport of 0.25 mm 2DG was monitored in the presence of the indicated NDGA concentrations (n = 4). IC 50 values were obtained by nonlinear fitting of the data to a 1‐parameter hyperbolic inhibition model (solid lines). Transport panels correspond to Hanes–Woolf plots of 2DG saturation curves done in the absence (●) or in the presence of 30 (■) or 60 μm (▼) NDGA in U‐937 and HL‐60 cells, respectively (n = 4). Trapping panels correspond to Hanes–Woolf plots of 2DG saturation curves for trapping (40‐min assays) done in the absence (●) or in the presence of 60 (■) or 120 μm (▼) NDGA (n = 4) in U‐937 and HL‐60 cells, respectively. In Hanes–Woolf plots, solid lines correspond to linear fits of the data, and a common intercept in the abscissa and increasing slopes are indicative of noncompetitive inhibition. Data are shown as mean ± SD.
