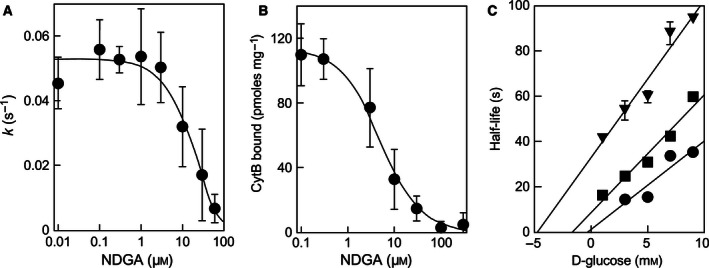
Figure 3.

NDGA interaction with GLUT1 in human erythrocytes. Panel A: dose dependence of the inhibition of net d‐glucose exit rate from human erythrocytes by NDGA. The solid line represents the nonlinear fit of the data to a 1‐parameter hyperbolic inhibition model with an IC 50 value of 26 ± 13 μm (n = 4). Panel B: NDGA displacement of the d‐glucose‐displaceable cythocalasin‐B bound to the glucose transporter GLUT1 in human erythrocyte ghosts. The solid line represents the nonlinear fitting of the data to a 1‐parameter hyperbolic inhibition model with a KD app of 4.5 μm (n = 1). Panel C: Sen–Widdas plot of the half‐time of d‐glucose exit at different concentrations of d‐glucose in the external medium in the absence (●) or in the presence of 7.5 (■) or 15 μm (▼) NDGA (n = 5). Solid lines correspond to linear regression fit for each curve. All data are shown as mean ± SD.
