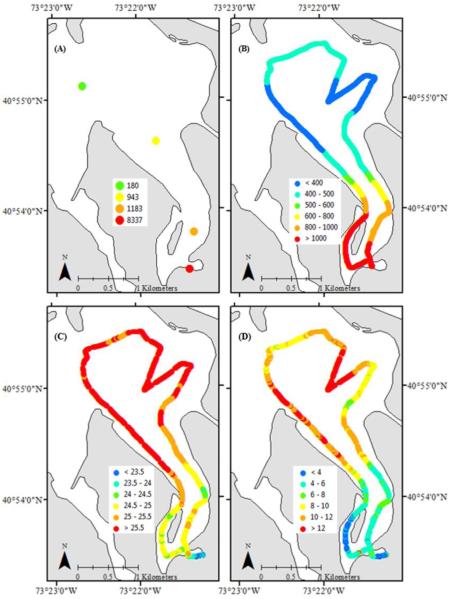
Figure 7.
Maps of A) Alexandrium densities (cells L−1), B) pCO2 (μatm) as measured by a HydroC™/CO2 (Contros) probe, and C) salinity and D) chlorophyll a (μg L−1) as measured by a YSI 6920v2 probe, from a horizontal transect conducted in Northport Bay in May of 2012. Points in (A) represent individual samples/sites where cruise tracks in (B-D) represent multiple data points taken in close proximity via probes.

