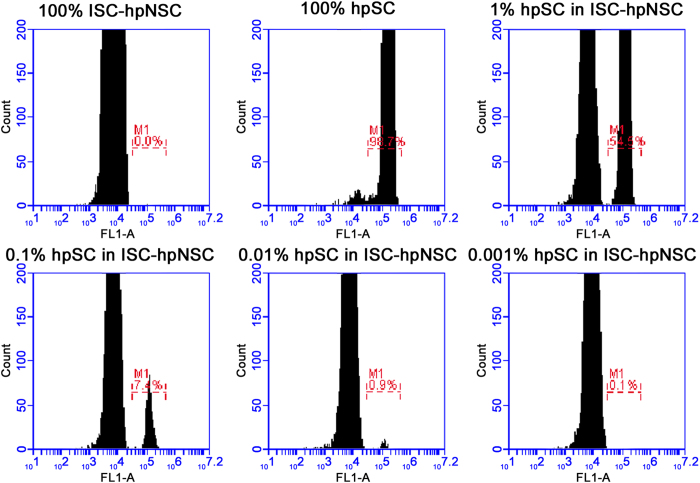
Figure 2. Flow cytometry analysis after magnetic separation of ISC-hpNSC and hpSC populations.
Flow cytometry analysis of OCT-4 expression of the different cell populations in this experiment: 100% ISC-hpNSC, 100% hpSC, 1% hpSC in ISC-hpNSC, 0.1% hpSC in ISC-hpNSC, 0.01% hpSC in ISC-hpNSC, and 0.001% hpSC in ISC-hpNSC population. The pure 100% ISC-hpNSC was the only cell population without OCT-4 expression signal.

