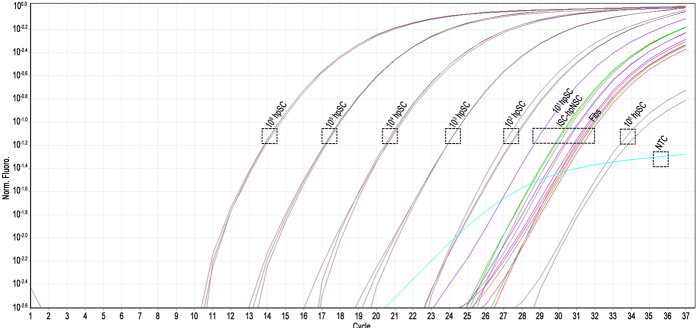
Figure 3. qRT-PCR analysis of ISC-hpNSC.
Log curves for quantitation of the qRT-PCR analysis of ISC-hpNSC with dotted squares indicating the groupings of each sample run in triplicate. ISC-hpNSC and human fibroblasts group with the same level of POU5F1 expression of 10 hpSC. The negative control (NC) samples are below the 1 hpSC (100 hpSC) cell reaction. Linearity of curves Ct was between 17–35 cycles.

