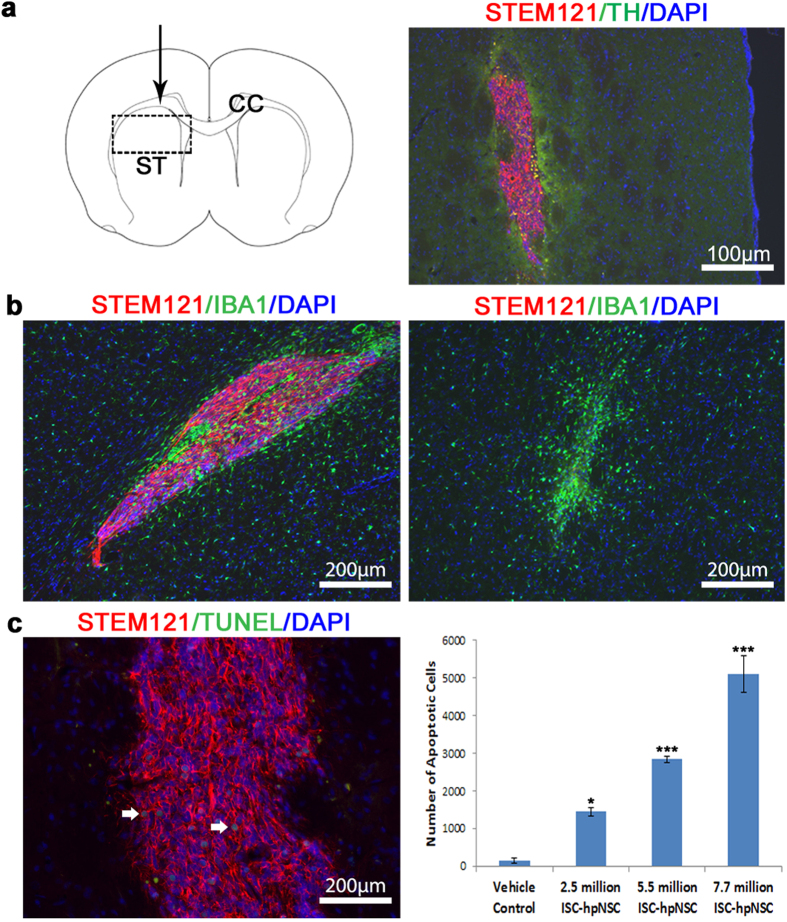
Figure 4. Acute toxicity study of ISC-hpNSC.
(a) Engraftment of ISC-hpNSC in the striatum of athymic nude rats. On the left is the coronal section with the dotted rectangle showing the location where the ISC-hpNSC graft was found. The black arrow represents the direction of the injection site. ST: striatum; CC: corpus callosum. On the right is a higher magnification micrograph showing the ISC-hpNSC graft stained for anti-STEM121 (red), anti-tyrosine hydroxylase (green), and DAPI (blue). (b) IBA-1+ staining comparison between rats receiving ISC-hpNSC or vehicle control. On the left is the ISC-hpNSC graft and on the right is the injection site in the vehicle control animal stained for anti-STEM121 (red), anti-IBA-1 (green) and DAPI. The number of IBA-1+ microglia cells surrounding the ISC-hpNSC graft is comparable to the number found at the injection site in the vehicle control animals. (c) TUNEL staining and quantification of apoptotic cells in animals injected with vehicle control and escalating doses of ISC-hpNSC. White arrows point to the apoptotic cells. Data was expressed as average ± SEM, one-factor ANOVA with Dunnett test comparing number of apoptotic cells of ISC-hpNSC doses against vehicle control: n = 3; α = 0.05; ***P < 0.001; *P < 0.05.

