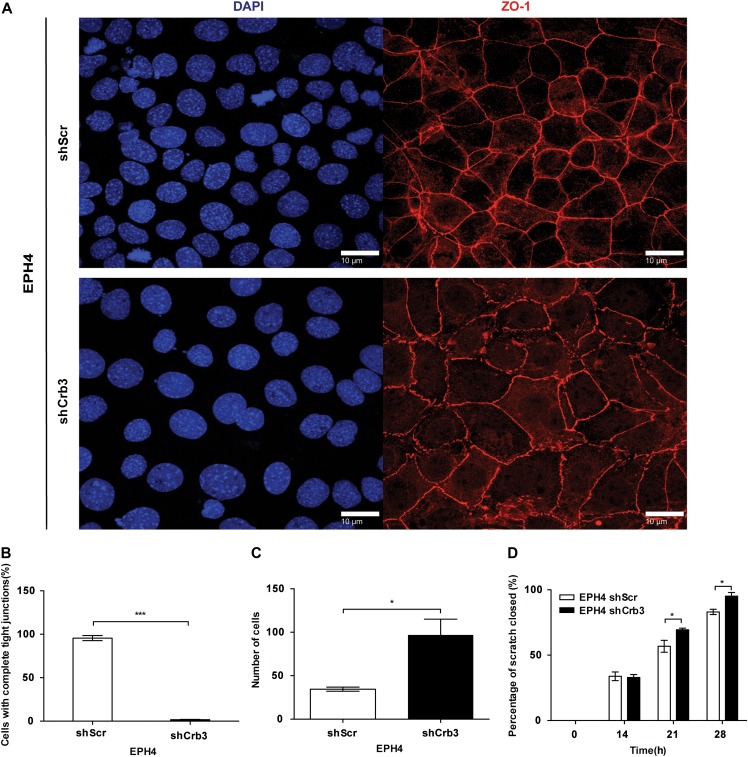
Figure 6.
CRB3 suppresses migration in EPH4 cells. (A) Immunofluorescent confocal imaging of EPH4-shScr and EPH4-shCrb3 cells grown on glass coverslips. Monolayers were stained for TJ marker, ZO-1. Scale bar, 10 μm. (B) The areas completely enclosed by TJs were counted. Data are presented as the mean of 5 independent experiments. Error bars represent ±SD (n = 5). (C) Wound closure ability of stable cells was assessed by a wound-healing assay. Error bars represent ±SD (n = 9). (D) EPH4-shScr and EPH4-shCrb3 cells were cultured in Boyden chambers across a serum gradient for 24 h, and migration was assessed. Error bars represent ±SD (n = 9). For all experiments, the Student's t-test was used. *P < 0.05, ***P < 0.001.

