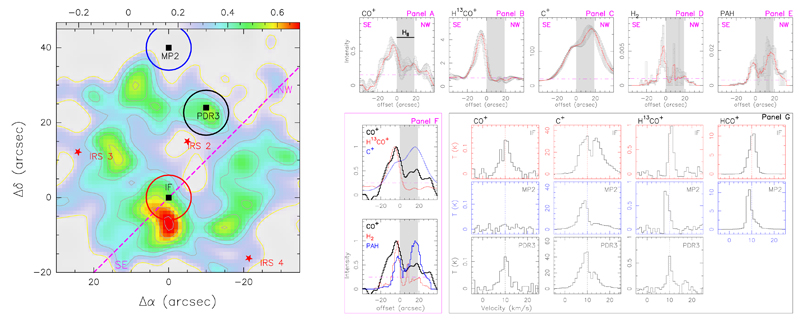
Fig. 2.
Left: CO+ integrated emission (see Fig. 1). The pink-dashed line indicates the direction of the intensity cuts. The color circles indicate the positions where spectra were extracted. Right: Panel A to E show the intensity cuts (red continuum lines) of CO+, H13CO+, [CII], H2 and PAHs. In these panels, the gray continuum lines indicates the errors in the cuts. Panel F shows the comparison of the intensity cuts scaled to unity. In Panels A to F, the pink dot-dashed indicate the 3σ level for each species and the gray area indicates the position of the UC HII region. Panel G shows the CO+, [CII], H13CO+ and HCO+ spectra at IF, MP2 and PDR3. The color of the boxes are related to this positions (circles in left panel).

