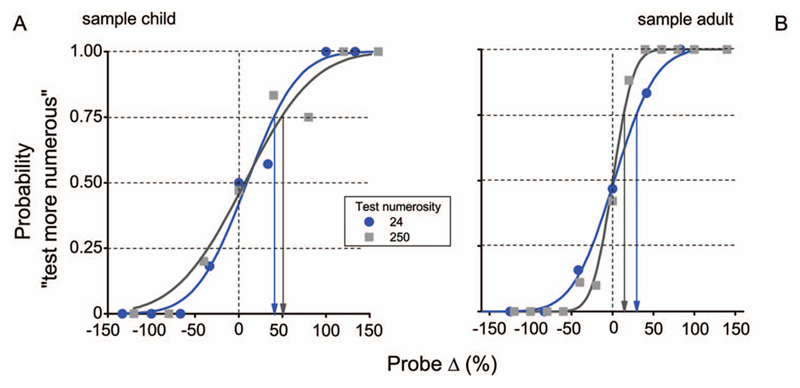
Figure 2.
Sample psychometric functions in the numerosity discrimination task for a sample child (A) and adult (B), for two levels of numerosity (N 24 and N 250 dots). Data show the probability of judging the test stimulus as more numerous then the probe, as a function of the difference between test and probe. Discrimination thresholds were measured as coefficient of variations = just notable difference/test numerosity. Just notable difference (Jnd) here is defined as the increase in dots to pass from 50% to 75% “greater” responses (black and blue arrows).

