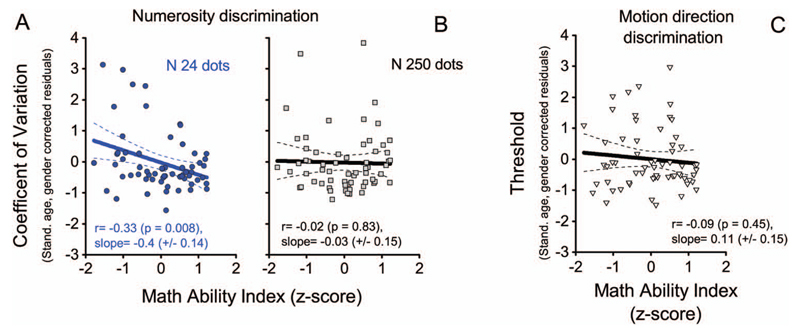
Figure 5.
A and B) individual coefficient of variations (age and gender corrected) in the numerosity discrimination task for the two measured numerosities (N 24 in panel A; N 250 in panel B), plotted as a function of standardized math skills level (higher number correspond to better math performance). C) Motion discrimination thresholds (age and gender corrected) as a function of math skills. Lines represent best-fitting regressions.

