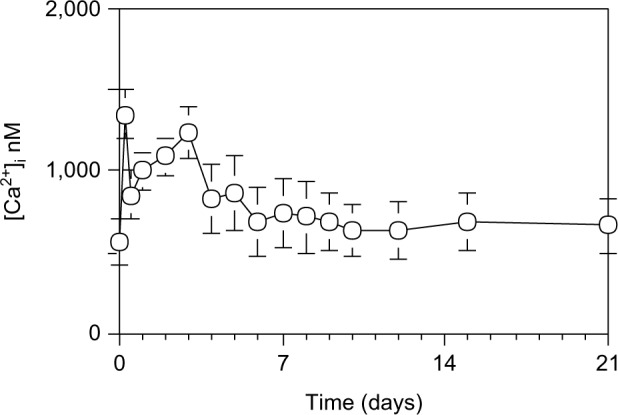
Figure 3.

[Ca2+]i in hepatocytes during liver regeneration after 70% PH.
Notes: The [Ca2+]i concentration was measured using the fluorescent Ca2+ indicator fura-2. Hepatocytes were loaded with 5 µM fura-2-AM under continuous shaking for 30 minutes. After two washes with PBS (pH 7.4), the cells were incubated at 37°C for 5 minutes. Hepatocytes (1×10⁶ cells) were resupended in 1 mL Ca2+- and Mg2+-free HBSS in a 10 mm quartz cuvette, and the fluorescence was measured at an emission wavelength of 500 nm and excitation of 340 or 380 nm using spectrofluorometer. Each point is presented as mean ± SD for three rats.
Abbreviations: AM, acetoxymethyl ester; PBS, phosphate-buffered saline; PH, partial hepatectomy; SD, standard deviation; HBSS, Hanks’ balanced salt solution.
