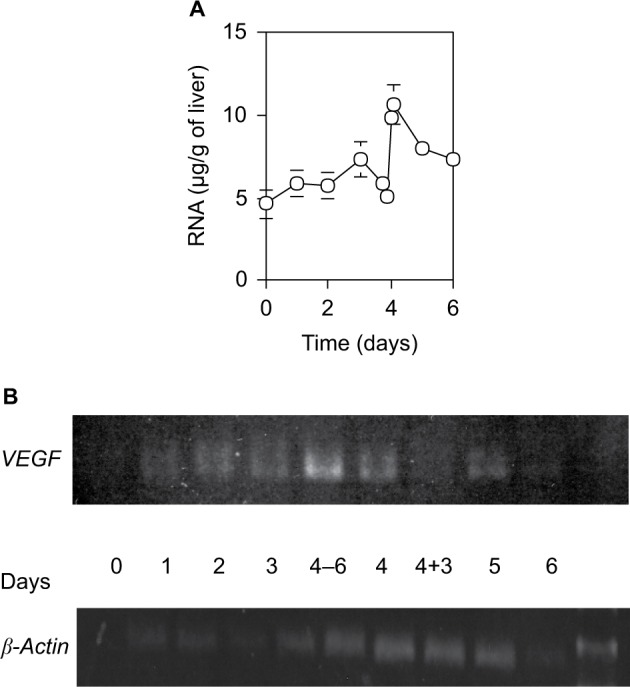
Figure 6.

RNA content (A) and expression levels of VEGF and β-actin (B) in the liver.
Notes: (A) Total RNA in 2 g of wet liver was isolated with acid phenol, and calculated by the optical density at 260 nm. Each point presents as the mean ± SD for four rats. (B) VEGF gene expression was estimated by RT-PCR. Day 4–6 and 4+3 indicate 6 hours before day 4 and 3 hours after day 4, respectively.
Abbreviation: SD, standard deviation.
