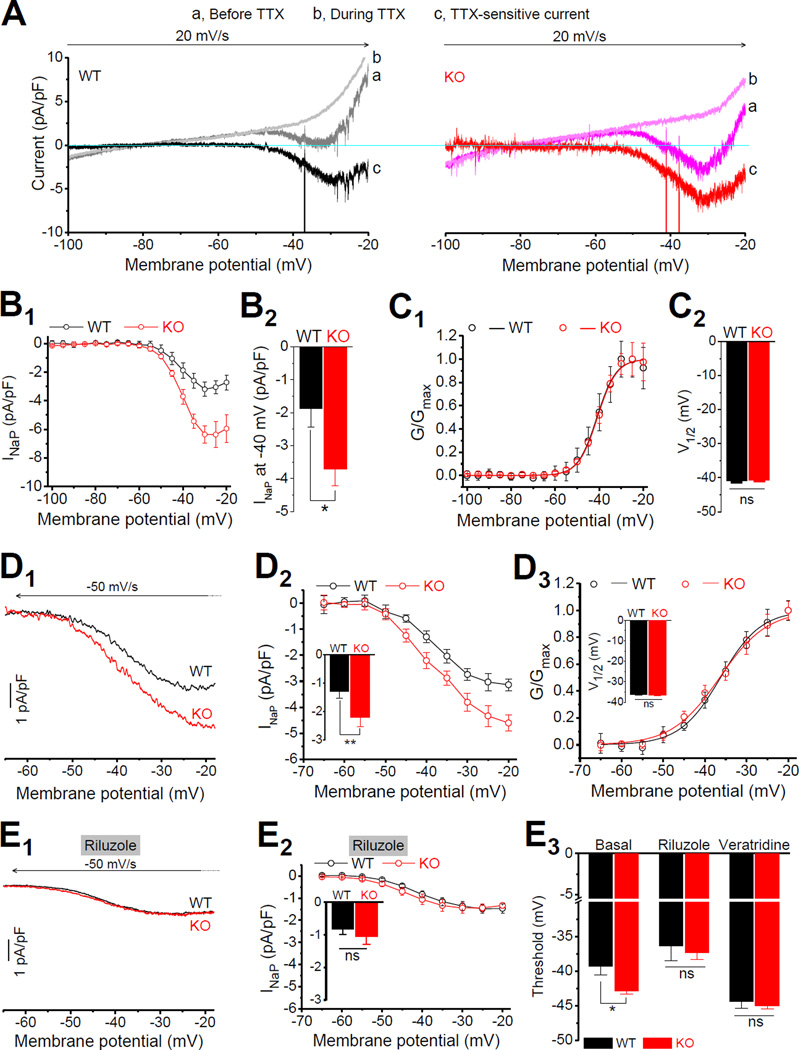
Figure 3. Enhanced Persistent Na+ Current Underlies AP Threshold Changes in Fmr1 KO neurons.
(A) INaP evoked by a depolarizing voltage ramp (−100 to −20 mV, 20 mV/s) before (traces a) and during (traces b) application of TTX. TTX-sensitive current (traces c) was obtained by subtraction. Note that the large escaped AP currents were truncated to emphasize the INaP.
(B) I-V curves (B1) were constructed from the ramp evoked INaP (mean current value over 0.01 mV intervals from averages of 4–5 trials for each cell to approximating quasi-steady state current). Currents were normalized to corresponding cell capacitance for better comparison. (B2) INaP at −40 mV was significantly large in Fmr1 KO neurons.
(C) Voltage-dependent activation curve of INaP (C1). Data fitted by Boltzmann function. Summarized data of half activation voltage V1/2 (C2).
(D) INaP evoked by a repolarizing ramp (D1, +30 to −65 mV, −50 mV/s). For better comparison with (A), the traces are presented in the same direction as in (A) in a −65 to −20 mV range. Arrow indicates the time direction. (D2) The difference of I-V curves between WT and Fmr1 KO neurons. Insert: INaP at −40 mV. (D3) The voltage-dependent activation of INaP in Fmr1 KO and WT neurons. Insert: V1/2 of INaP activation.
(E) Effects of INaP inhibitor riluzole on the INaP and AP threshold in Fmr1 KO and WT neurons. (E1) Sample INaP traces. (E2) I-V curves. Insert, INaP at −40 mV. (E3) Effects of INaP inhibitor riluzole and INaP opener veratridine on AP threshold.
* p < 0.05; ** p < 0.01; ns, not significant. All data are mean ± SEM.

