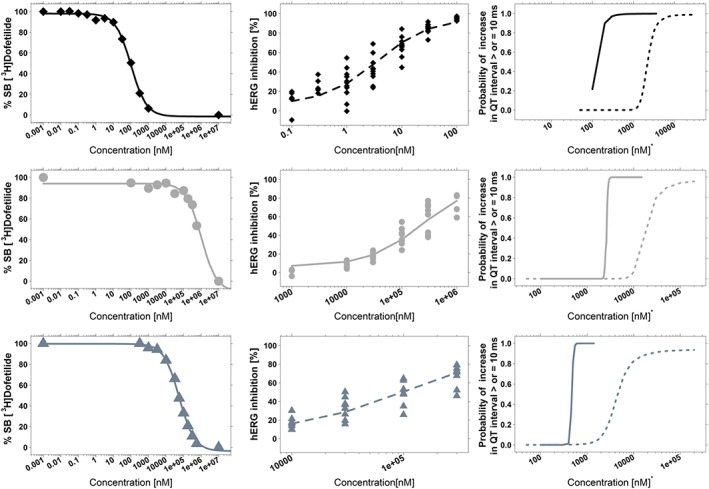
Figure 1.

Overview of the concentration–effect relationships derived from in vitro (binding vs. functional hERG assay) and in vivo data (QT prolongation) in dogs and humans for cisapride (top), moxifloxacin (middle) and sotalol (bottom). Left panels show the dofetilide displacement assay; mid panels display the functional hERG patch clamp assay, whereas the curves depicting the concentration versus probability of reaching ≥10 ms QT prolongation in dogs (dotted line) and humans (solid line) are shown on the right panels (Chain, Dubois et al., 2013). In all plots, the lines represent the model‐based population predictions and the symbols the experimental observations. For group size details see Tables 2, 3 and 4.
