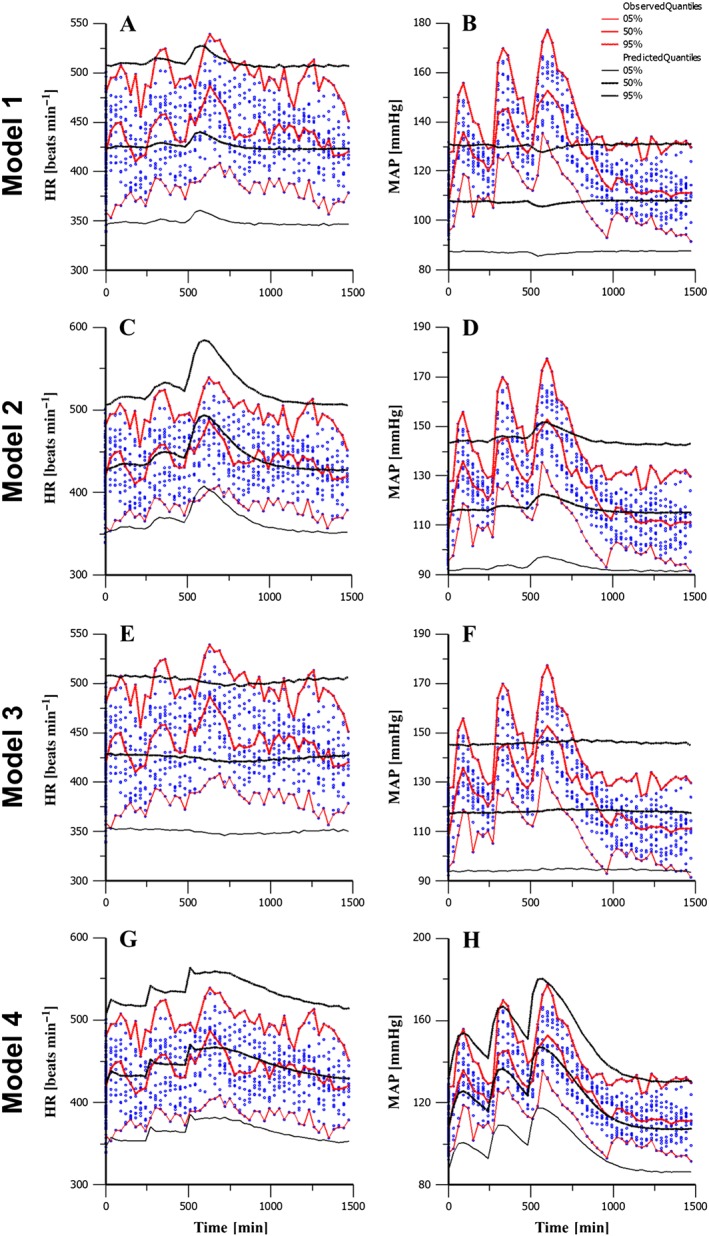
Figure 5.

Best fits of the CV population models to HR and MAP observations. Panels (A–B) show HR and MAP best fits resulting from a fit to TPR alone. Panels (C–D) show HR and MAP fits for baclofen effect on HR alone. Panels (E–F) show HR and MAP from drug effect on SV alone. Panels (G–H) show HR and MAP resulting from simultaneous effect on HR, SV and TPR.
