Figure 6.

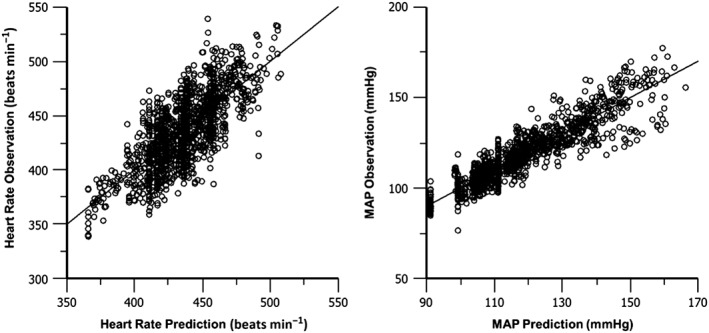
Individual predictions versus the observations of HR and MAP for best fit of Model 4. Each point represents the model prediction for that individual compared against the actual observed data that was measured at that time point.

Individual predictions versus the observations of HR and MAP for best fit of Model 4. Each point represents the model prediction for that individual compared against the actual observed data that was measured at that time point.