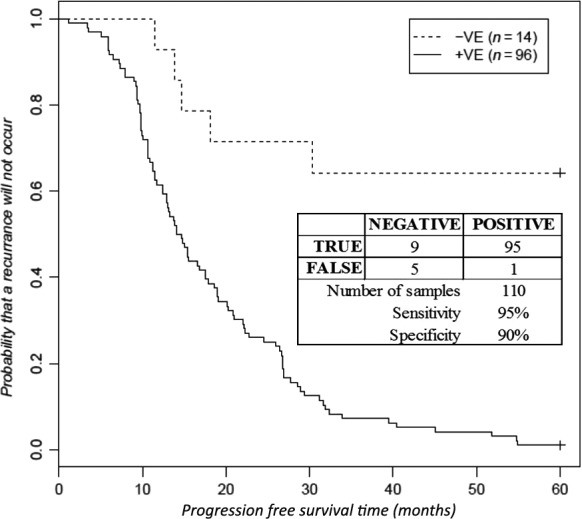
Figure 3.

A Kaplan–Meier plot predicting progression‐free survival probabilities for 110 high‐grade serous ovarian adenocarcinoma (HGS‐OvCa) samples with a positive, or negative Cancer‐Progression Association Signature (C‐PAS) test result. A C‐PAS test outcome is denoted as positive if one or more mutations is detected at any of the C‐PAS motifs shown in Table 3. Similarly, a C‐PAS test result is denoted as negative if no mutations are found to occur at any of these C‐PAS test motifs. The Cox P‐value is 1.57E‐05, and the Log‐Rank P value is 7.86E‐07. The associated sensitivity (95%) and specificity (90%) measures are included in the inset. The mutation data and the test result for each sample are shown in the Table S1.
