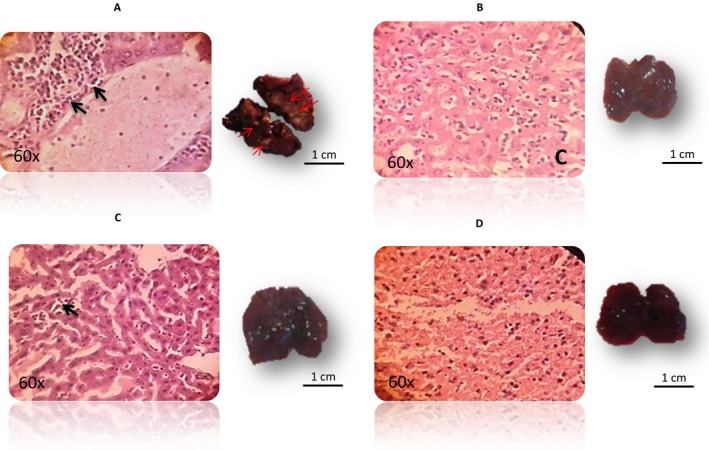
Figure 6.

(A–D) The liver tissues histology (left) of tumor‐bearing mice from Control, Maitake Pro4X, Maitake Standard, and the normal liver from animals without breast tumor that resist carcinogenesis after treatment with Maitake Pro4X, respectively. Black arrows represent the cell proliferation area. Right pictures from each histology, represents the liver tissue in each condition. Red arrows represent the metastasis area.
