
Figure 7.
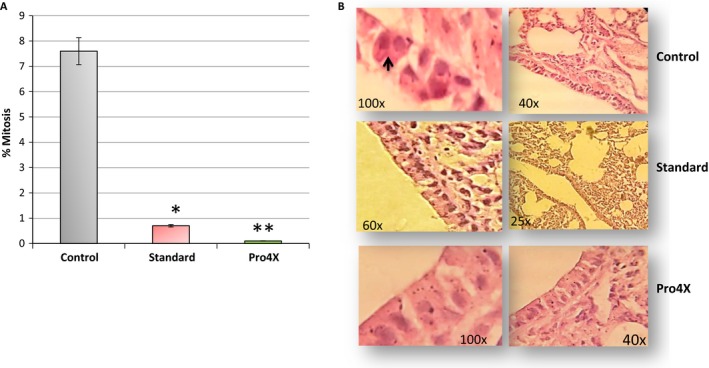
Study of mitogenesis in lung tissues. In (A) represents the % of mitosis in lung tissue at each condition. *P < 0.05, and **P < 0.01. (B) The pictures from the histology of lung tissue in every group: Control, Standard and Pro4X. The right pictures represent a magnification of left image at 60–100X. Black arrow in (B) from control group represents the mitosis.