Figure 8.

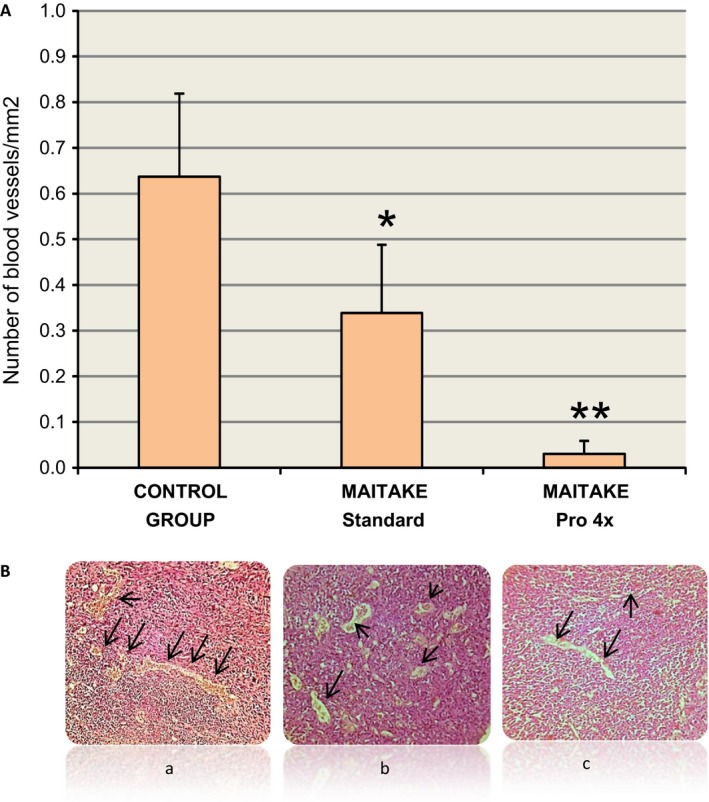
(A) The graphics of average of blood vessels density/mm2 in each group. (B) shows the pictures of breast tumors analyzed, Black arrows indicated the size of blood vessels in each condition. *P < 0.05, **P < 0.01.

(A) The graphics of average of blood vessels density/mm2 in each group. (B) shows the pictures of breast tumors analyzed, Black arrows indicated the size of blood vessels in each condition. *P < 0.05, **P < 0.01.