
Figure 10.
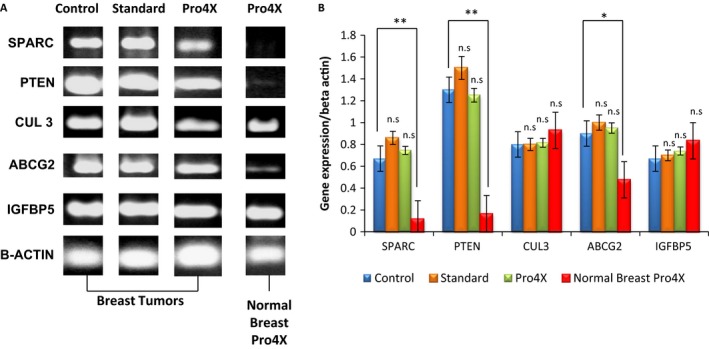
Gene Expression analysis. (A) The gene expression at mRNA level in all the conditions. (B) Relative quantification of each RT‐PCR reaction. *P < 0.05, and **P < 0.01.
Official websites use .gov
A
.gov website belongs to an official
government organization in the United States.
Secure .gov websites use HTTPS
A lock (
) or https:// means you've safely
connected to the .gov website. Share sensitive
information only on official, secure websites.
Gene Expression analysis. (A) The gene expression at mRNA level in all the conditions. (B) Relative quantification of each RT‐PCR reaction. *P < 0.05, and **P < 0.01.