
Figure 5.
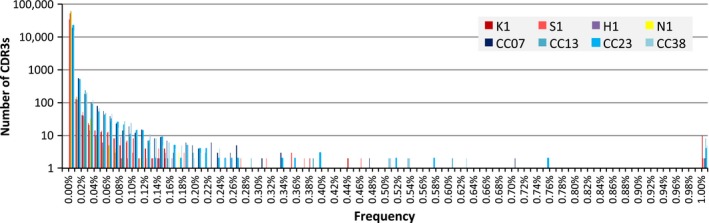
Frequency fractions of CDR3 amino acid sequences. A total of 100,000 molecules were selected from each pool of sequenced molecules, and the numbers of TCRB amino acid types of each frequency fraction were deduced. CDR3, complementarity‐determining region 3; TCRB, T‐cell receptor beta chain.