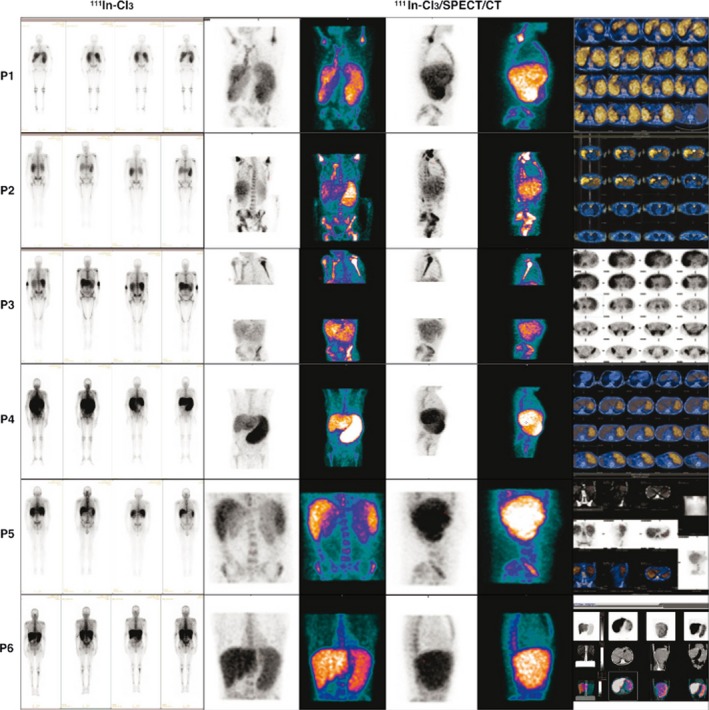
Figure 2.

111In‐Cl3‐scintigraphy (Covidien) with single‐photon emission tomography/computed tomography acquisitions. Representative imaging of the results is shown here. UPN1 to UPN4 and UPN6 were primary myelofibrosis patients; UPN5 was a secondary (post‐ET) MF patient.
