
Figure 2.
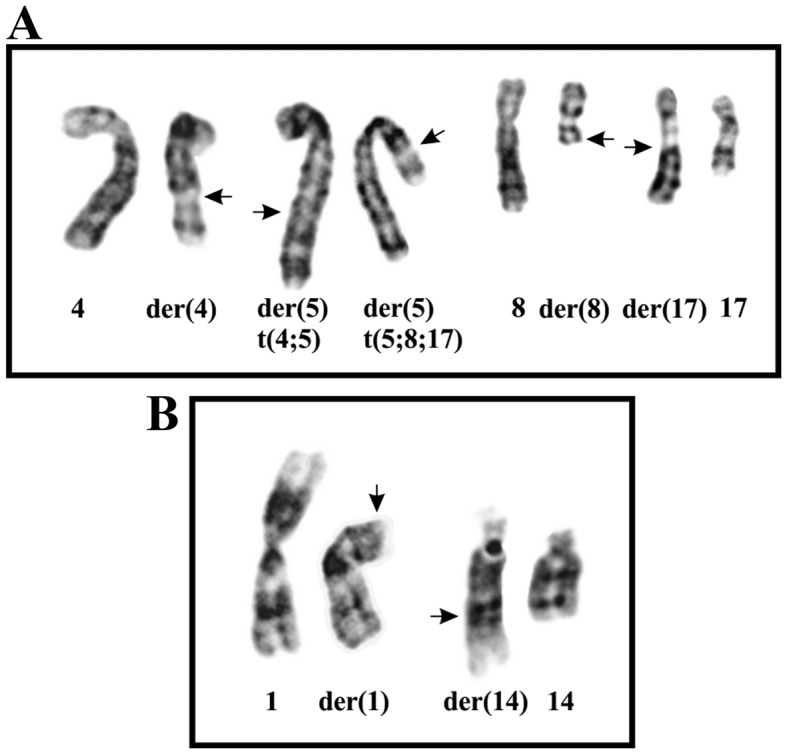
Cytogenetic analysis of the angiofibroma of soft tissue. (A) Partial karyotype showing from left to right the chromosomes 4, der(4)t(4;5) (q24;q31), der(5)t(4;5)(q24;q31), der(5)t(5;8;17)(p15;q13;q21), 8, der(8)t(5;8;17) (p15;q13;q21), der(17)t(5;8;17)(p15;q13;q21), and 17. (B) Partial karyotype showing the der(1)t(1;14)(p31;q32) and der(14)t(1;14)(p31;q32) together with the corresponding normal chromosome homologs. Breakpoint positions are indicated by arrows.