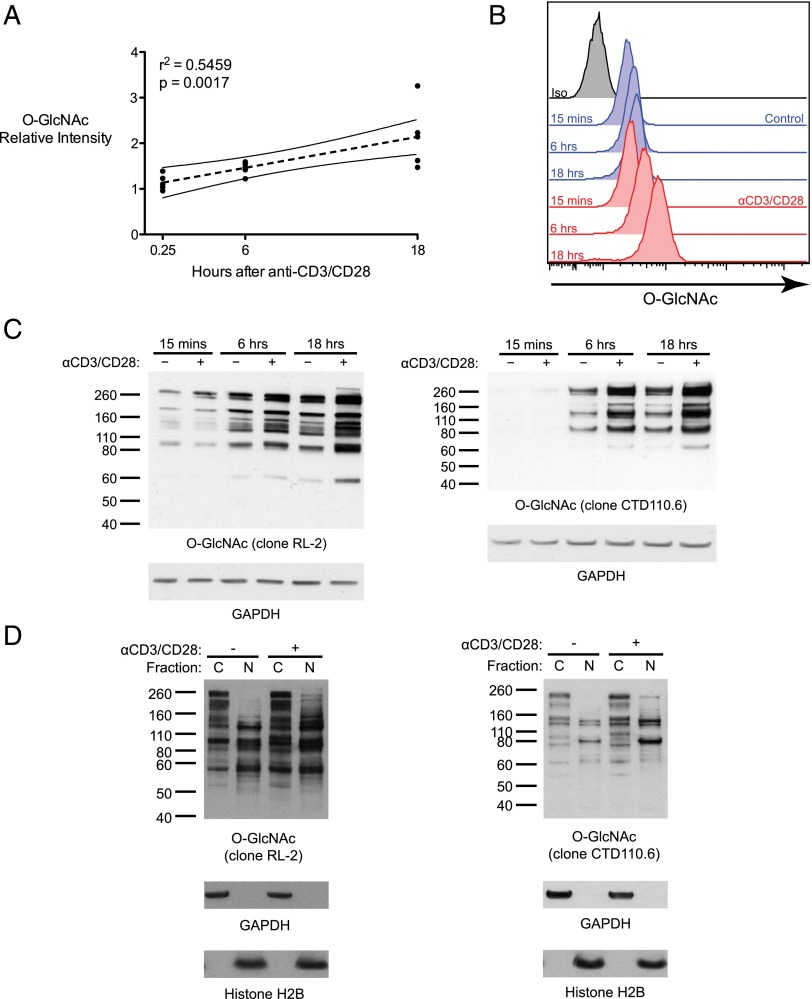
FIGURE 1.
Global levels of O-GlcNAc glycosylation increase after T cell activation. (A) Primary human T cells were incubated with control beads or anti-CD3/CD28 beads and then analyzed for O-GlcNAc by flow cytometry. The staining intensity of stimulated cells relative to control cells at each time point is plotted (five donors over three independent experiments) along with the mean and 95% confidence interval of a linear regression analysis. (B) Representative line graphs are shown for one donor. (C) Whole-cell lysates from control and stimulated T cells were analyzed for O-GlcNAc levels by immunoblot with anti-O-GlcNAc Ab RL-2 or CTD110.6. GAPDH served as a loading control. A total of at least two donors over at least two independent experiments were analyzed with similar results for each blot. (D) Cytosolic (C) and nuclear (N) extracts from T cells incubated with control beads or anti-CD3/CD28 beads for 18 h were analyzed for O-GlcNAc levels by immunoblot with anti–O-GlcNAc Ab RL-2 or CTD110.6. GAPDH and histone H2B served as controls for loading and compartmentalization. A total of three donors over two independent experiments were analyzed with similar results for each blot.

