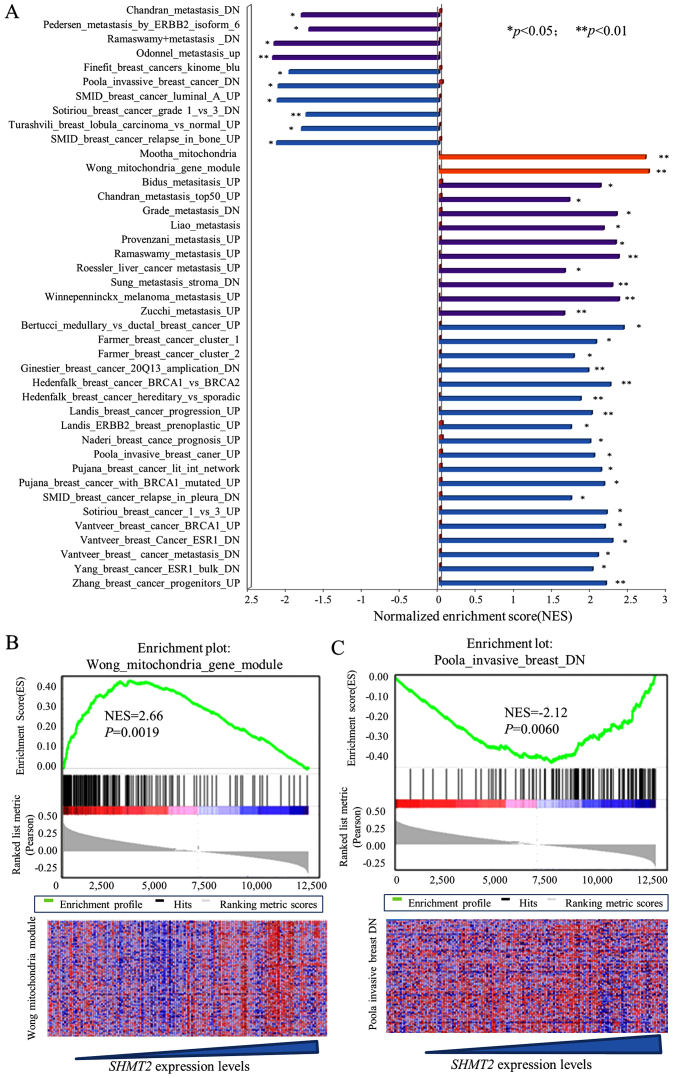
Figure 1.
Enrichment gene set analysis for SHMT2 mRNA expression and gene signatures in breast cancers. The normalized enrichment score (ES) represents the strength of the relationship between phenotype and gene signature. The statistical significance of each signature is labeled at the side of the bar (*p<0.05, **p<0.01). Detailed information about this computational method can be obtained from ref. 30. The heat maps indicate the correlation between phenotype and expression levels of each signature gene. Columns are individual samples, and rows represent each gene. Each cell in the matrix represents the expression level of a gene in an individual sample. Red indicates a high level of expression, and green indicates a low level of expression; blue bars are invasive breast cancer signatures; purple bars are gene signatures associated with metastasis; yellow bars are mitochondria signature modules. (A) GESA analysis of SHMT2-high breast cancer. (B) GSEA results of the Wong mitochondria module. (C) Analysis results of Poola invasive breast cancer (downregulation) gene signature.

