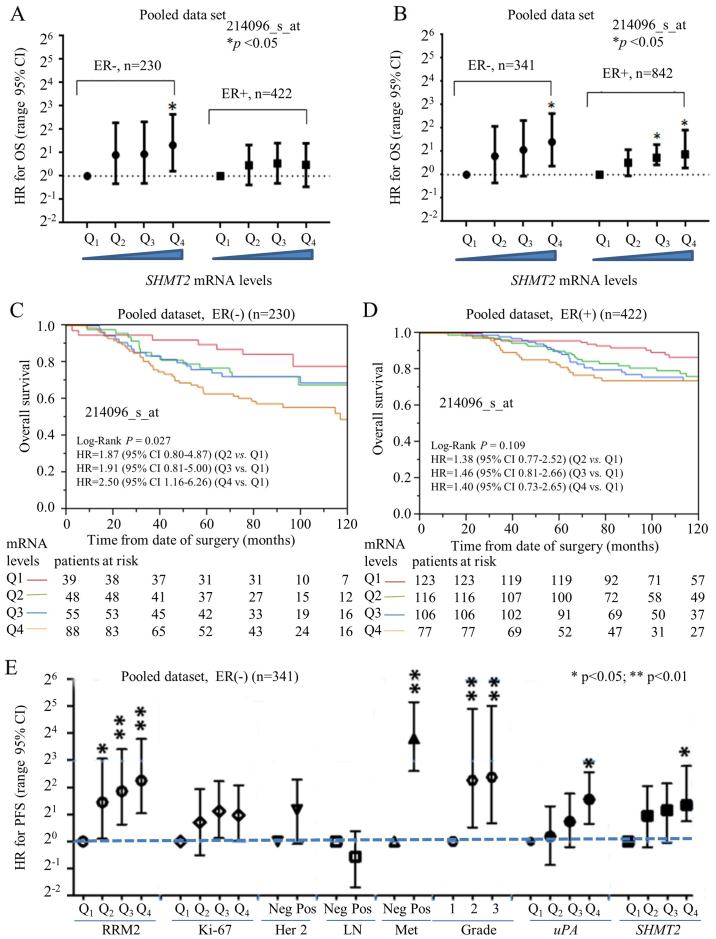
Figure 4.
Stratification analysis for prognostic performance of SHMT2 in subgroups of ER-negative and ER-positive breast cancers. For the public breast cancer microarray data, we pooled all eligible breast cancers after normalization. (A) Cox proportional hazard analysis of SHMT2 for OS in ER-negative and ER-positive breast cancer. (B) Comparison of prognostic value of SHMT2 for PFS between ER-negative and ER-positive breast cancer. (C) Kaplan-Meier analysis was used to visualize the dose-dependent relationship between SHMT2 and the OS in ER-negative breast cancer. (D) mRNA levels of SHMT2 and OS in ER-positive breast cancer. (E) Comparing the prognostic performance of SHMT2 with other factors in ER-negative breast cancers. The HR of OS for various expression levels of SHMT2, HER2, lymph node involvement, distant metastasis, Elson grade, uPA and RRM2 were determined using Cox proportional hazard analysis. LN, lymph node; Met, metastasis; *p<0.05, **p<0.01.

