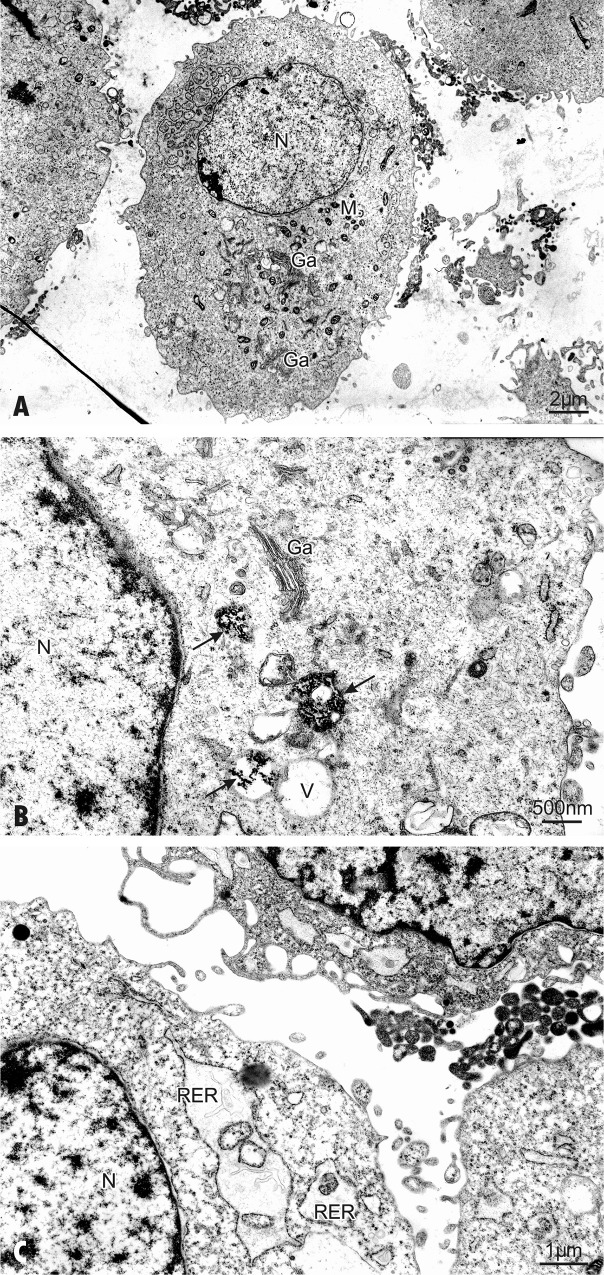
Fig 2. The TEM examination of hFOB 1.19.
(A) The ultrastructural features of a control cell; mitochondria (M), nucleus (N), Golgi complex (Ga); (B-C) Cells exposed to AgNPs 30 μg/mL for 24 h. cell. (B) AgNPs are found within the cell (arrows). Micrographs show vacuoles (V) with randomly oriented AgNPs of quite regular morphology (arrows). The well-developed Golgi complex (Ga) is located in the cytoplasm in perinuclear areas. (C) Cells exposed to AgNPs 30 μg/mL for 24 h show swelling of the endoplasmic reticulum. Ribosomes may have dissociated from the endoplasmic reticulum (RER) and the cytoplasm is filled with free ribosomes. The nucleus (N) presents a normal aspect.

