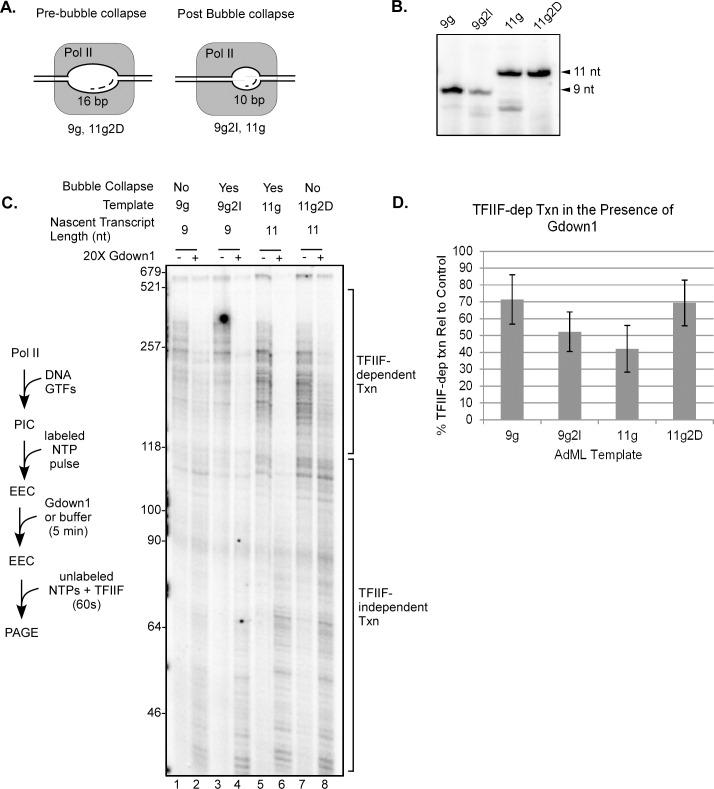
Fig 6. Functional binding of Gdown1 to EECs is enhanced following transcription bubble collapse.
(A) Schematic showing the expected sizes of transcription bubbles for EECs paused at the initial G stops on the templates used in this figure (see [30]). (B) 20% denaturing PAGE showing the nascent RNAs generated following the initial pulse. Arrows on the right indicate the expected transcript size relative to the G stop in the template. (C) EECs were generated in solution on AdML 9g, 9g2I, 11g, and 11g2D templates with CpA, dATP, UTP, and [α-32P]CTP as described in Materials and Methods. EECs were then incubated with 240 fmol of Gdown1 or buffer for 5 min and chased for 30 sec with 200 μM NTPs. Lengths of markers are shown on the left edge of the gel and TFIIF-dependent and TFIIF-independent transcript lengths are noted on the right. A schematic of the assay is shown to the left of the gel. (D) Average percents of TFIIF-dependent transcription were quantified from results like those shown in panel (C) as described in Materials and Methods. The error bars indicate mean ± S.D. based on three to six replicates per individual template.

