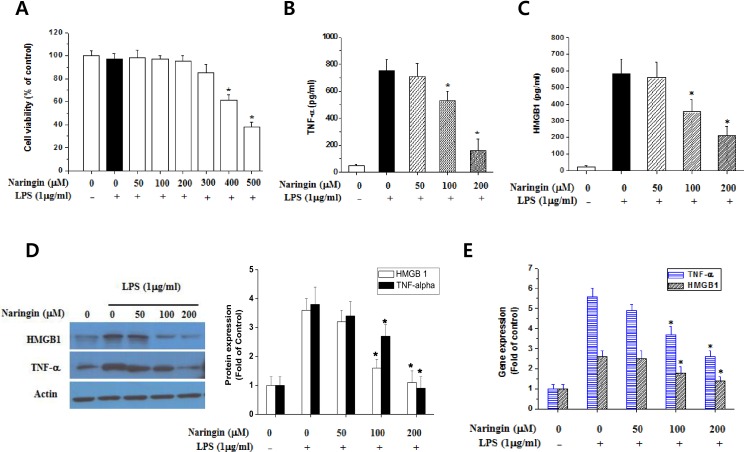
Fig 1. Naringin’s effect on the expression of TNF-α and HMGB1 in LPS-stimulated macrophages.
Cells were pretreated with naringin for 1 h at the doses indicated in the figure. The cells were then stimulated with LPS (1 μg/ml) for 24 h. Cell viability was measured by MTT assays (A). The culture medium was collected and subjected to ELISA to measure the TNF-α (B) and HMGB1 (C) concentrations. Cells were harvested, lysed, and subjected to western blot (D) and RT-PCR (E) to determine TNF-α and HMGB1 levels. *Significantly different from LPS-treated cells.

