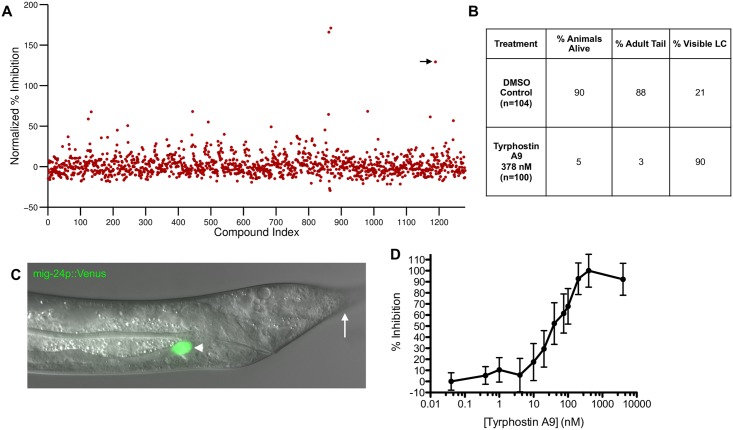
Fig 3. Tyrphostin A9 causes linker cell persistence.
(A) Screen of the LOPAC library using Tyrphostin A9 as a positive control. Compounds are plotted with an arbitrary index (X-axis). Percent inhibition (Y-axis) is normalized to negative control and positive control (Tyrphostin A9 treated) counts for each plate screened. The Tyrphostin A9 data point is indicated (arrow). (B) Effects of Tyrphostin A9 on animal viability, development, and linker cell presence are compared to DMSO exposure alone. LC, linker cell. (C) Image of a tra-2(ar221);xol-1(y9) mig-24p::Venus animal, treated with Tyrphostin A9 for 12 hours, showing persistent fluorescent linker cell (arrowhead) and undeveloped tail (arrow). (D) Effect on linker cell persistence after 12 hours of treatment with varying concentrations of Tyrphostin A9. Negative control mean is defined as 0% inhibition and maximum linker cell count in Tyrphostin A9 treated animals is defined as 100% inhibition. The EC50 for Tyrphostin A9 is calculated to be 45.6 nM.

